Determination of air distribution and estimating the quality of mixing in an Aeration Tank
Determination of air distribution and estimating the quality of mixing in an Aeration Tank
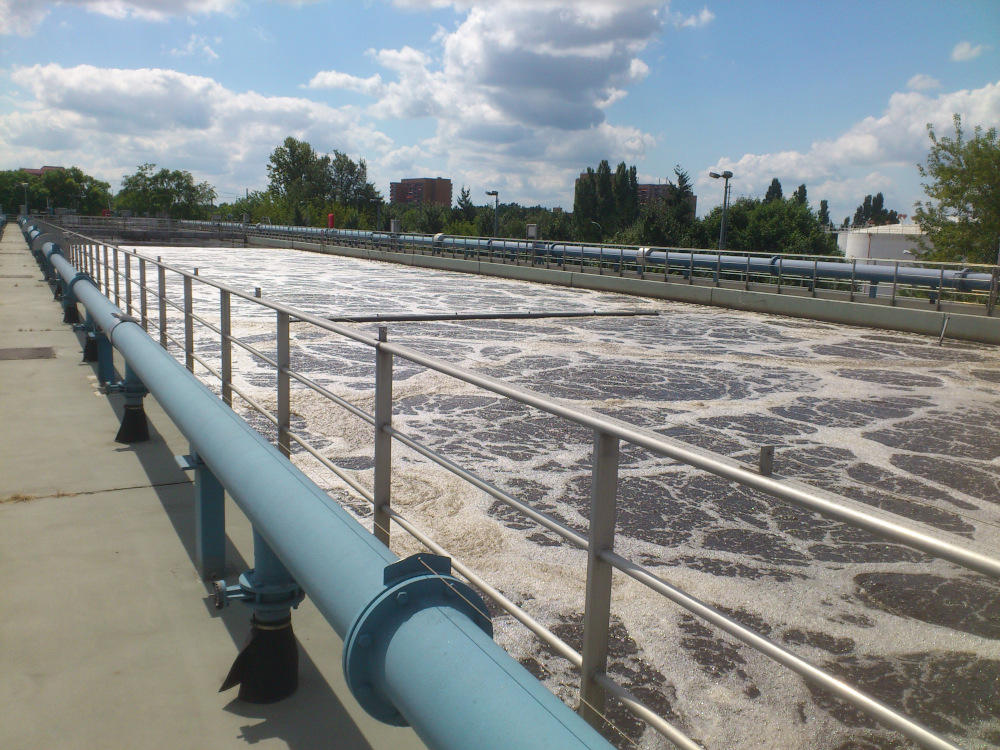
Aeration tanks in wastewater treatment plant promote the biological degradation of sewage. Inside the tanks, air diffusers and blowers create an oxygen-rich environment to support the growth of aerobic microorganisms. These microbes break down organic contaminants and reduce the biochemical oxygen demand before getting discharged for downstream processes. The distribution of air and sludge needs to be uniform for an effective aeration process. Therefore, mixers can be provided in the aeration tanks for providing desirable thrust for mixing. Due to this thrust, the fluid around the mixers experiences higher momentum. Higher mixing velocities should be avoided as they can affect the bacterial colonies.
Some of the challenges involved in aeration tank are:
Inadequate mixing can lead to areas with insufficient oxygen, impacting the efficiency of pollutant degradation.
High residence time, i.e., if the water stays in the tank for too long, then the solid particles might settle down forming different layers.
CFD can help in estimating the time of residence of water along with the concentration of air in the aeration tank. It also helps in identifying any vortex formation and presence of dead (stagnation) zones in aeration tank. With these insights, improvements can be made to mitigate the problems.
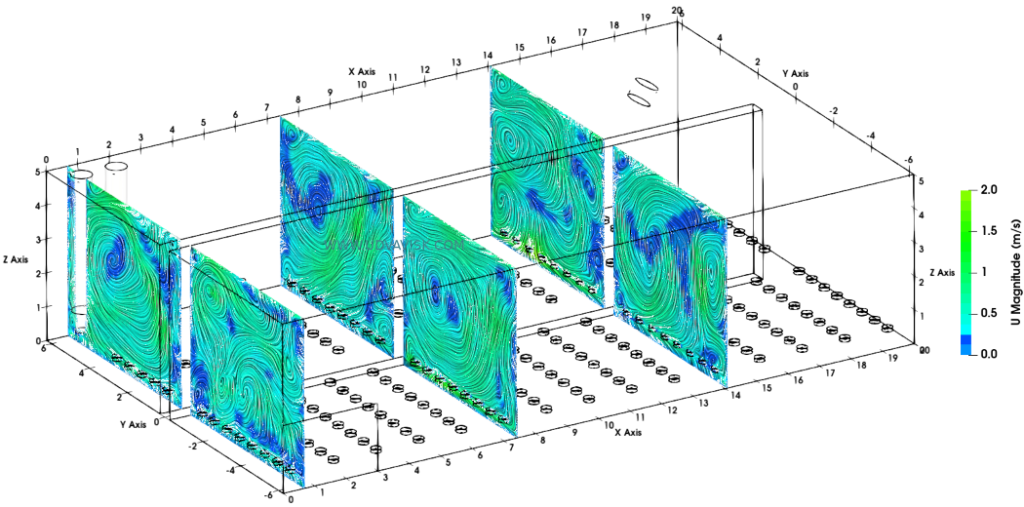
The velocity and volume percentage of air (supplied as air parcels from disc-type diffusers at bottom of the tank) can be visualized in the below images. The velocity contours in the tank shows, large scale vortex along with velocity exceeding 0.3 m/, which is good for bulk mixing.
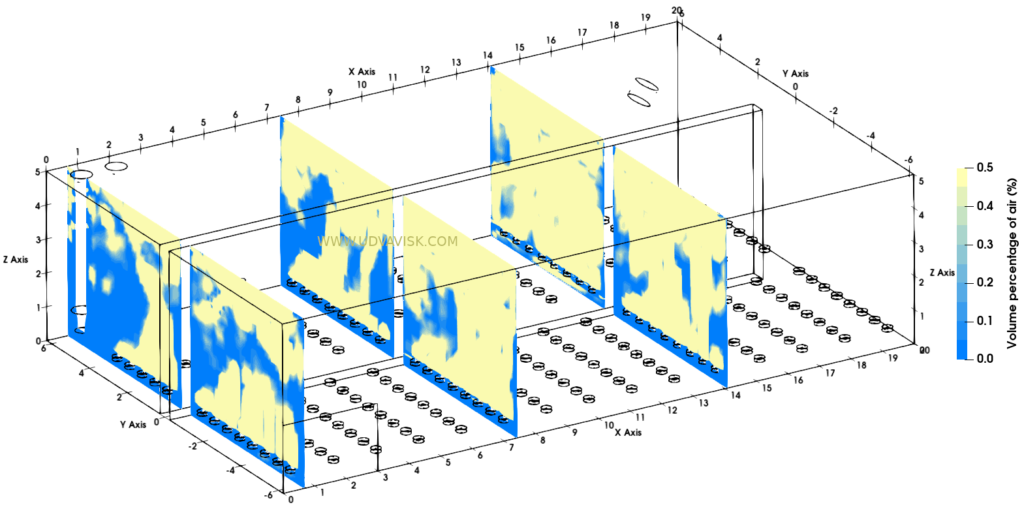
The volume percentage of air indicated in three different planes shows air reaches most of the region of the aeration tank as air-bubbles propagate through. The air bubbles reach a broader area towards the surface of water (moving far from the disk diffusers). However, there are some regions showing a volume percentage of air less than 0.1%. The velocity in the regions where the air bubbles concentration is less than 0.1% can be visualized applying threshold as in the below image.
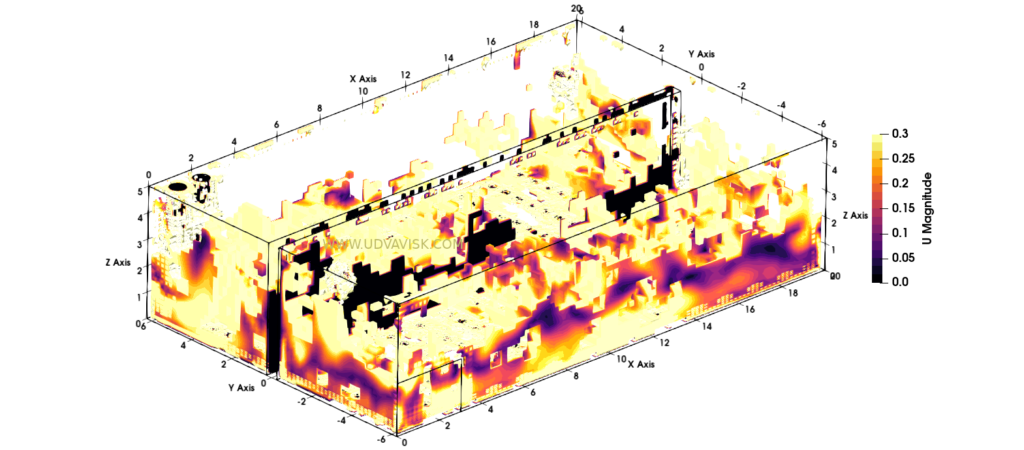
Even in lower concentration zones of air, a velocity value exceeding 0.3 m/s is available. Hence advective transport of air is good at most of the low-air concentration regions. So, this is a good indicator about the aeration process. It can be inferred that air transportation is good throughout the tank. The lifetime (age) of the air bubbles introduced by the diffusers can be interpreted from the below contour.
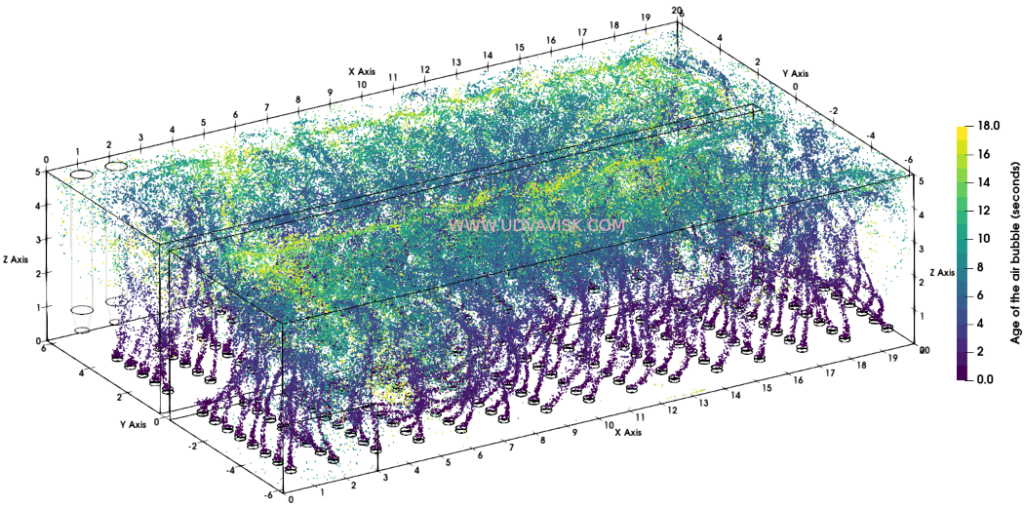
The average lifetime of an air bubble inside the aeration tank is estimated to be around 7 seconds. This means that air bubbles generated by the diffuser reach the water surface in approximately 7 seconds. The above study can also be extended for determination of residence time of water inside the tank, also the pump suctions can be analysed to determine swirl angles and air-entrainment to the pump.

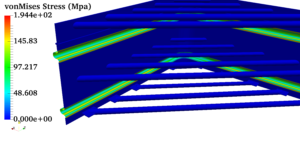
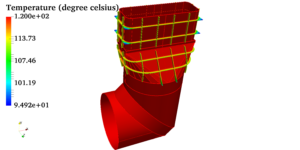
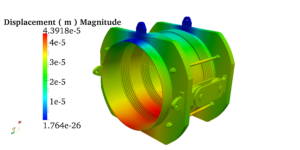
 Pressure vessels, pipes, expansion joints etc. are basic equipments for process industries. Pressure vessels are vessels working under internal, external or vacuum pressure, and possibly subjected to high temperature. Proper design and analysis is very important for the pressure vessels, as their failure can cause lot of hazards. Codes/ standards are used in the design phase, followed by analysis to ascertain stresses are within the allowable range. ASME provides wide range of guidelines for the proper design of such vessels.