Under floor vortex formations and Temperature Distributions in a Data Center Server Hall
Under floor vortex formations and Temperature Distributions in a Data Center Server Hall
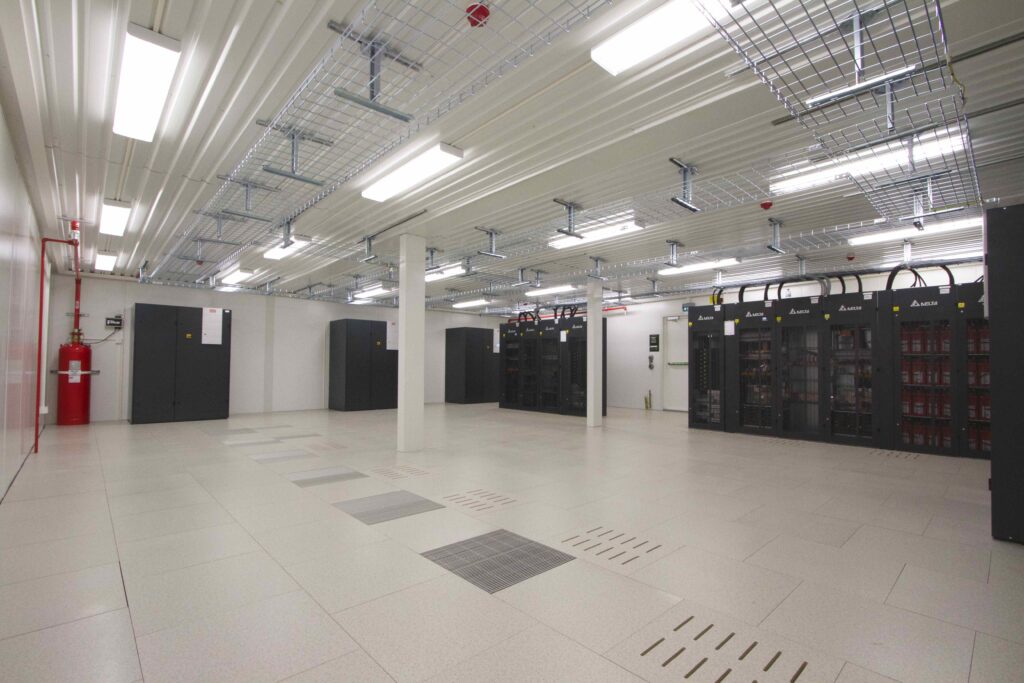
Information Technology Equipment (ITEs) and its associated components are housed in air-conditioned Data-Halls. These air-conditioning systems provide adequate cooling to avoid equipment down-times. In case of improper cooling, hot-spots might appear near the ITEs. The data-hall air-conditioning can be ensured by variety of arrangements of supply and return grilles, equipment placements, containments and CRAH (Computer Room Air-Handling) unit locations.
Some of the challenges in the thermal management of the data hall are,
Inappropriate cold air distribution, often due to incorrect pressurization.
Servers located at a particular location of rack may consume most of the incoming cold air. Consequently, there will be an insufficient amount of cold air available to cool the servers positioned anywhere else in the racks, resulting in the emergence of hotspots.
Positioning of servers, supply grilles and returns which plays a pivotal role in maintaining uniform flow that caters to all servers across the facility.
Occurrence of vortices in the underfloor region (for data-halls with under-floor supplies) can cause a back flow.
To address and tackle these challenges, Computational Fluid Dynamics (CFD) emerges as a valuable tool. CFD offers the capability to analyse and visualize the temperature and flow distribution within the data hall. Through this analysis, it becomes possible to identify regions prone to hotspots as well as the presence of any vortices beneath the floor void. With these insights, improvements can be made to mitigate the problems.
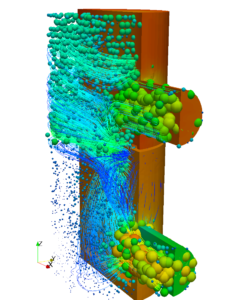
An under-floor data hall has been considered for a sample CFD analysis to show-case vortex formation in the under floor and to observe presence of hot-spots (if any). The CRAH units supply air to the underfloor region, subsequently the air passes to the cold-aisles through supply grilles located on floor. After entering the cold-aisle, cold air passes through the gap between the servers placed in the racks (this way, carrying away the heat generated by ITEs) and moves to the hot aisle containments (HACs). From the HACs, the air then ascends to the ceiling void eventually returning to the CRAH units. In such data-hall with hot-aisle and cold-aisle arrangements, all non-essential gaps on racks, as well as space for future server space are provided with blanking plates. All these ensure a better flow for the servers in racks.
The temperature distribution inside the data hall can be visualized with temperature contours as shown below.
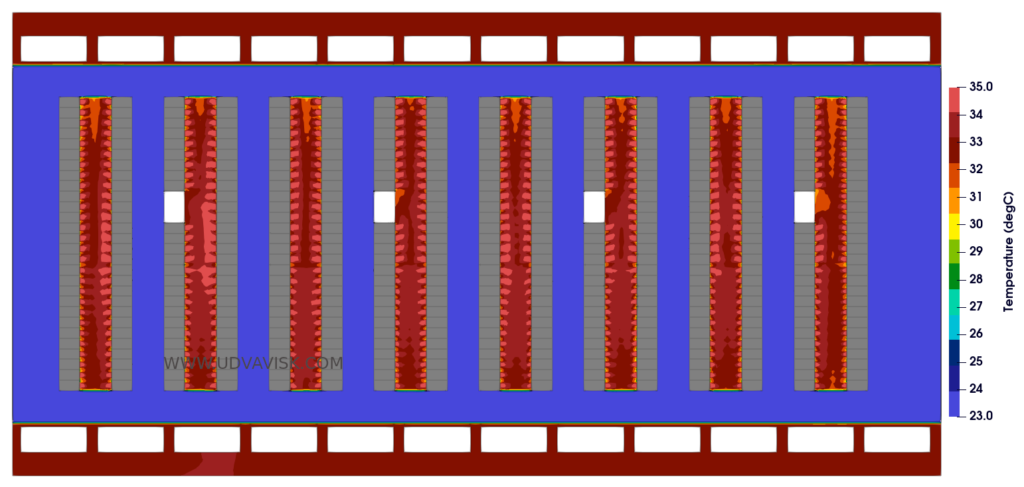
From the above contour, temperature in cold aisles corresponds to a range below 24 °C. Thus, the temperatures are within the acceptable range (18 °C to 27 °C) as specified in AHRAE White Paper (TC9.9) for cold aisles. Similarly, temperature distribution inside hot aisles can be interpreted via temperature contours.
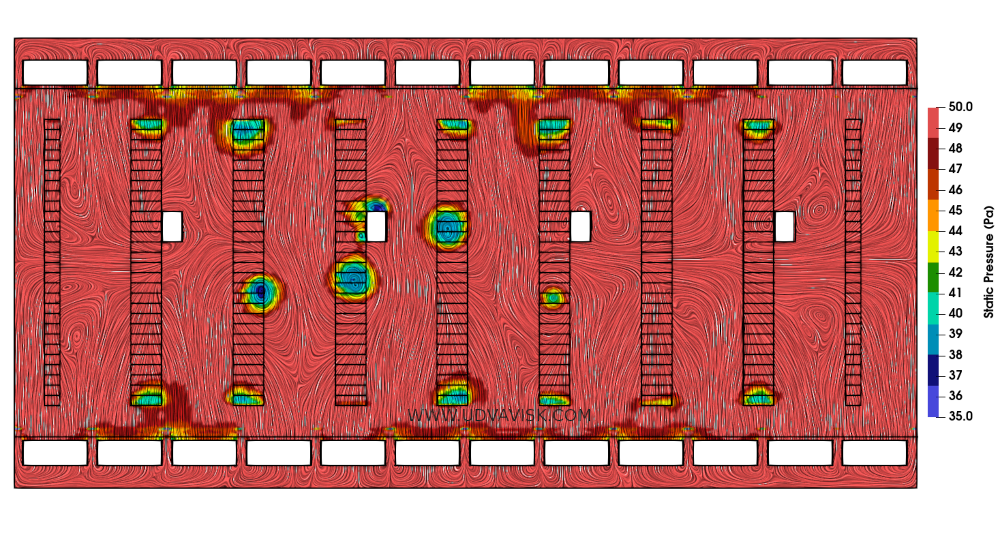
Numerous vortices have been observed under the floor. The vortices, in this case happens due to the interaction of flows from opposite CRAH units (on either side of the data-hall). Some of the vortices are below the supply grilles. Vortex centre being a low-pressure region, it can cause a flow directed from the cold-aisle into the floor-void. The vortex that can hamper flow in the supply grilles.
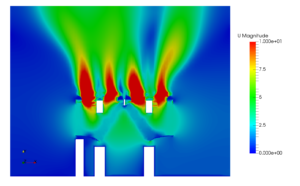
These vortices can be interpreted as low pressure zones as indicated in the plot below. The pressure in the under-floor exceeds 50 Pa for most of the places, except the supply grilles with vortical structures. The pressure minima have a pressure around 38 Pa to 40 Pa.

 Pressure vessels, pipes, expansion joints etc. are basic equipments for process industries. Pressure vessels are vessels working under internal, external or vacuum pressure, and possibly subjected to high temperature. Proper design and analysis is very important for the pressure vessels, as their failure can cause lot of hazards. Codes/ standards are used in the design phase, followed by analysis to ascertain stresses are within the allowable range. ASME provides wide range of guidelines for the proper design of such vessels.